Argonauta 7-12 2011
 |
 |
Tab. 1

|
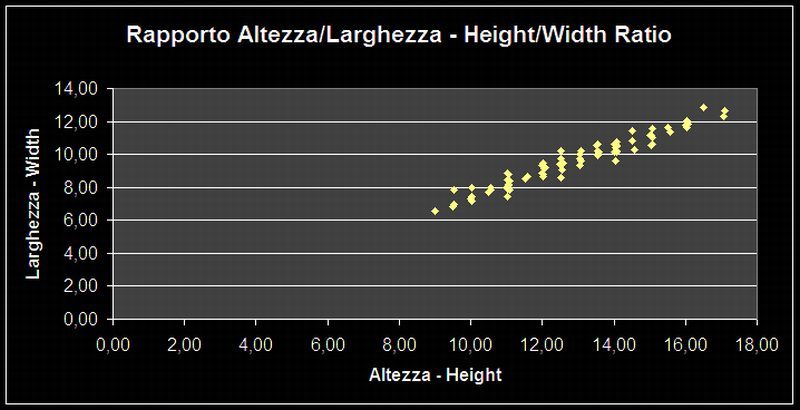
La tabella 1 riporta un grafico di dispersione dove sono riportate le misure di altezza e larghezza in mm. La "retta di crescita" è semplicemente normale e non mostra situazioni anomale degne di rilievo.
Purtroppo avevo a disposizione una fotocamera nuova della quale non avevo ancora sperimentato l'uso. Ne ho ricavato immagini non molto buone delle quali espongo solo alcune delle foto, meno mosse o sfocate, e i cinque campioni che si scostano, anche se solo leggermente, dalla "retta di crescita normale". |
Table 1 shows a scatter chart which shows the measurements of height and width in mm. The "line of growth" is simply normal and shows no significant abnormal situations. Unfortunately I used a new camera with which I had no experience. I got bad image among which I have chosen the less moves or blurred and the five samples that differ, if only slightly, from "line of normal growth." |

|
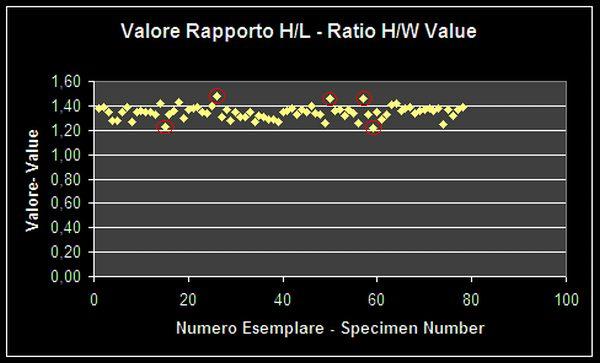
Nella Tabella 2 sono rappresentati i valori del rapporto Altezza/Larghezza di tutti i campioni. Dalle misurazioni è scaturito un valore medio di:
Altezza = 12,95 Largezza = 9,63 Rapporto H/L = 1,35 |
Table 2 shows the values ??of the height/width ratio of all samples. From the measurements resulted in a mean value of: Height = 12.95 Width = 9.63 Ratio H/W = 1.35 |
